Blackjack Expected Value Chart
These original tables show the modeled expected value of blackjack starting hands against every dealer up-card—in cents per dollar of the original bet. Green is profit and red is loss. Switch between six-deck H17 and S17; the methodology states the rules and approximations.
Find your hand on the left, the dealer's up-card across the top. The cell is the average result per $1 if you play that hand by basic strategy. Example: 16 vs 10 ≈ −53.5¢ means you lose about 53 cents on the dollar — the worst common spot in the game.
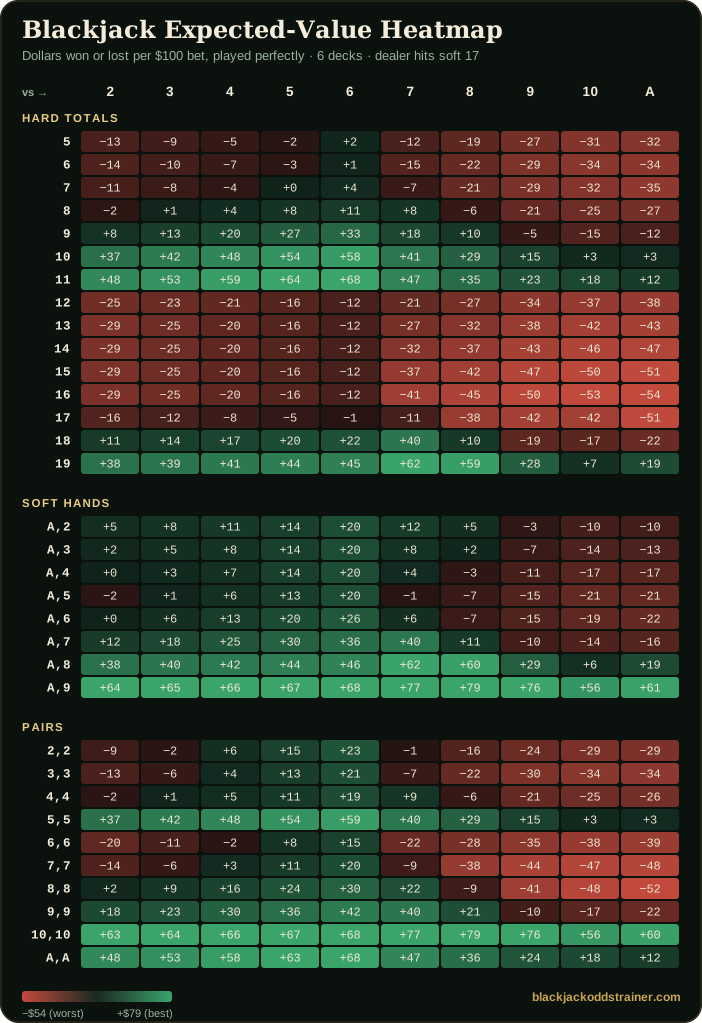
Hard totals
| Hand | 2 | 3 | 4 | 5 | 6 | 7 | 8 | 9 | 10 | A |
|---|---|---|---|---|---|---|---|---|---|---|
| Hard 5 | −12.6¢ | −9.3¢ | −5.5¢ | −1.6¢ | +2.0¢ | −12.0¢ | −18.8¢ | −26.6¢ | −31.3¢ | −31.8¢ |
| Hard 6 | −13.9¢ | −10.4¢ | −6.7¢ | −2.7¢ | +1.0¢ | −15.5¢ | −22.0¢ | −29.5¢ | −33.9¢ | −34.4¢ |
| Hard 7 | −11.1¢ | −7.7¢ | −3.8¢ | +0.1¢ | +3.6¢ | −6.9¢ | −21.4¢ | −28.9¢ | −32.2¢ | −35.3¢ |
| Hard 8 | −2.4¢ | +0.8¢ | +4.4¢ | +8.0¢ | +11.2¢ | +8.4¢ | −5.9¢ | −21.2¢ | −25.0¢ | −26.6¢ |
| Hard 9 | +7.5¢ | +13.0¢ | +19.8¢ | +26.7¢ | +32.5¢ | +17.7¢ | +10.1¢ | −5.2¢ | −15.2¢ | −12.5¢ |
| Hard 10 | +36.8¢ | +42.1¢ | +47.8¢ | +53.6¢ | +57.8¢ | +40.6¢ | +29.2¢ | +14.9¢ | +2.7¢ | +3.3¢ |
| Hard 11 | +48.4¢ | +53.3¢ | +58.5¢ | +63.9¢ | +67.8¢ | +46.8¢ | +35.3¢ | +23.0¢ | +18.0¢ | +11.9¢ |
| Hard 12 | −25.3¢ | −23.3¢ | −20.6¢ | −16.1¢ | −12.1¢ | −21.3¢ | −27.2¢ | −34.0¢ | −37.5¢ | −38.2¢ |
| Hard 13 | −28.9¢ | −24.9¢ | −20.3¢ | −16.1¢ | −12.1¢ | −27.0¢ | −32.4¢ | −38.3¢ | −42.0¢ | −42.6¢ |
| Hard 14 | −28.9¢ | −24.6¢ | −20.3¢ | −16.1¢ | −12.0¢ | −32.5¢ | −37.0¢ | −42.8¢ | −46.3¢ | −46.9¢ |
| Hard 15 | −28.6¢ | −24.6¢ | −20.2¢ | −16.0¢ | −12.0¢ | −37.0¢ | −41.7¢ | −47.2¢ | −50.4¢ | −50.9¢ |
| Hard 16 | −28.7¢ | −24.7¢ | −20.3¢ | −16.1¢ | −12.4¢ | −40.9¢ | −45.4¢ | −50.5¢ | −53.5¢ | −54.0¢ |
| Hard 17 | −15.7¢ | −12.0¢ | −8.1¢ | −4.6¢ | −1.0¢ | −10.9¢ | −38.5¢ | −42.3¢ | −41.9¢ | −51.5¢ |
| Hard 18 | +11.0¢ | +13.8¢ | +16.5¢ | +19.6¢ | +22.1¢ | +39.7¢ | +10.4¢ | −18.6¢ | −17.5¢ | −22.5¢ |
| Hard 19 | +37.8¢ | +39.4¢ | +41.4¢ | +43.8¢ | +45.1¢ | +61.5¢ | +59.1¢ | +28.4¢ | +6.9¢ | +19.1¢ |
Hard 5–7 always hit (small negative EV); hard 18–20 always stand and are strongly positive — see the pairs table for 10,10. Totals follow the standard card values.
Soft hands (ace counted as 11)
| Hand | 2 | 3 | 4 | 5 | 6 | 7 | 8 | 9 | 10 | A |
|---|---|---|---|---|---|---|---|---|---|---|
| A,2 | +4.8¢ | +7.5¢ | +10.5¢ | +14.0¢ | +20.4¢ | +12.0¢ | +5.2¢ | −3.4¢ | −10.2¢ | −9.9¢ |
| A,3 | +2.4¢ | +5.2¢ | +8.4¢ | +13.9¢ | +20.3¢ | +7.6¢ | +1.6¢ | −7.3¢ | −13.7¢ | −13.5¢ |
| A,4 | +0.0¢ | +3.0¢ | +6.8¢ | +13.6¢ | +20.0¢ | +3.6¢ | −2.9¢ | −11.2¢ | −17.3¢ | −17.1¢ |
| A,5 | −2.0¢ | +0.9¢ | +6.4¢ | +13.2¢ | +20.4¢ | −0.9¢ | −7.0¢ | −15.2¢ | −21.0¢ | −20.9¢ |
| A,6 | +0.0¢ | +5.8¢ | +12.5¢ | +19.9¢ | +25.5¢ | +5.5¢ | −7.2¢ | −14.7¢ | −19.5¢ | −22.0¢ |
| A,7 | +11.7¢ | +17.5¢ | +24.5¢ | +30.3¢ | +35.9¢ | +40.2¢ | +10.8¢ | −9.9¢ | −14.3¢ | −16.0¢ |
| A,8 | +38.1¢ | +40.0¢ | +41.6¢ | +44.0¢ | +46.3¢ | +61.6¢ | +59.6¢ | +28.7¢ | +6.3¢ | +18.9¢ |
| A,9 | +63.8¢ | +64.5¢ | +65.6¢ | +67.1¢ | +67.8¢ | +77.3¢ | +79.1¢ | +75.9¢ | +55.5¢ | +60.5¢ |
Pairs
Pairs hold the biggest single-decision swings on the chart. Splitting 8,8 against a 9 turns a −50.6¢ hand (hitting) into a −40.8¢ one, and doubling 5,5 against a 6 — never split fives — is worth +58.7¢ against +16.8¢ for the split.
| Hand | 2 | 3 | 4 | 5 | 6 | 7 | 8 | 9 | 10 | A |
|---|---|---|---|---|---|---|---|---|---|---|
| 2,2 | −8.6¢ | −2.2¢ | +5.7¢ | +15.0¢ | +23.4¢ | −0.6¢ | −15.7¢ | −23.8¢ | −28.7¢ | −29.3¢ |
| 3,3 | −13.0¢ | −5.6¢ | +3.6¢ | +12.8¢ | +21.3¢ | −6.7¢ | −22.0¢ | −29.6¢ | −33.9¢ | −34.5¢ |
| 4,4 | −2.3¢ | +0.9¢ | +4.6¢ | +10.7¢ | +19.2¢ | +8.7¢ | −5.9¢ | −21.1¢ | −24.9¢ | −26.4¢ |
| 5,5 | +37.0¢ | +42.2¢ | +47.8¢ | +53.8¢ | +58.7¢ | +40.4¢ | +29.4¢ | +15.0¢ | +2.7¢ | +3.3¢ |
| 6,6 | −20.0¢ | −11.5¢ | −2.0¢ | +7.5¢ | +14.9¢ | −22.1¢ | −27.9¢ | −34.7¢ | −38.1¢ | −38.6¢ |
| 7,7 | −14.4¢ | −6.1¢ | +3.3¢ | +11.4¢ | +19.7¢ | −8.8¢ | −37.8¢ | −43.8¢ | −47.4¢ | −47.7¢ |
| 8,8 | +2.3¢ | +9.2¢ | +15.9¢ | +23.5¢ | +30.4¢ | +21.8¢ | −8.6¢ | −40.8¢ | −48.5¢ | −51.9¢ |
| 9,9 | +18.2¢ | +23.2¢ | +29.7¢ | +36.4¢ | +42.1¢ | +39.9¢ | +21.3¢ | −9.6¢ | −17.2¢ | −22.1¢ |
| 10,10 | +63.3¢ | +64.4¢ | +65.5¢ | +66.9¢ | +67.7¢ | +77.2¢ | +79.1¢ | +75.6¢ | +55.9¢ | +60.0¢ |
| A,A | +48.4¢ | +53.0¢ | +58.1¢ | +63.1¢ | +67.8¢ | +47.4¢ | +36.0¢ | +23.8¢ | +18.4¢ | +11.6¢ |
What the numbers reveal
- The dealer's up-card matters more than your hand. Look down any column: the dealer's 5 and 6 are red-bait for them — even your stiff totals turn less negative — while their 9, 10, and ace drag almost everything into the red.
- The best non-blackjack starting hand here is A,9 vs 8 at about +79.1¢ per dollar — the strongest made totals top the chart (a 20), followed by an 11 and premium pairs against a weak dealer card.
- The worst is 16 vs A at about −54.0¢ — every option loses, which is exactly when surrender earns its keep.
- Doubles and splits show their value here. Where basic strategy doubles (e.g. 11, soft hands vs 4–6) or splits (8,8 and A,A), the EV shown already accounts for the extra money at risk — that's why a doubled 11 reads so much higher than a flat hit.
How these were computed
No Monte Carlo sampling and no copied lookup values. For each hand the engine builds a dealer-outcome distribution from fixed shoe proportions, then evaluates stand, hit with optimal continuation, double, and an approximate split tree. The tables here are the 6-deck values; how many decks matter explains why fewer decks help the player. The full method is on our methodology page, and you can reproduce a starting hand with the hand calculator. Tables assume six decks, 3:2 blackjack, double after split, and the selected soft-17 rule.
Frequently asked questions
What does "expected value" mean here?
The average return per dollar of your original bet if you played the hand correctly thousands of times. +20¢ means the hand profits 20 cents on the dollar long-term; −50¢ means it loses 50. Basic strategy is just the EV-maximizing play for every hand.
Why is my made 20 not shown in the hard table?
A hard 20 is a pair of tens, so it lives in the pairs table (10,10) — where the correct play is always to stand on that very strong hand.
Do these EVs assume I play perfectly?
Yes — each cell is the value of the best play (basic strategy). Guessing instead of following the chart adds another 2–4% of loss on top of these numbers.
Can I use this data on my own site?
Yes. Every number here is downloadable as a free open dataset (CSV and JSON, all 3,300 rows across deck counts and H17/S17) under a CC BY 4.0 license — just cite "Blackjack Odds Trainer" and link back. Or embed our interactive tools directly.